US Dollar Weekly Forecast: DXY Breaks Higher Ahead of the Fed’s Key Inflation Gauge
Pipscollector - Weekly US Dollar (USD) Analysis Report
US DOLLAR WEEKLY FORECAST: BULLISH
- The US Dollar rose the most over 2 weeks since September
- Rising Treasury yields continued cooling Fed rate cut bets
- All eyes turn to the central bank’s preferred inflation gauge
- DXY broke above the 100-day SMA, broader reversal ahead?
Fundamental Analysis
The US Dollar rallied against its major counterparts this past week. In fact, the DXY Dollar Index rose about 1.9% over the past 2 weeks. That is the best 10-day period for the world’s reserve currency since the middle of September. Let us take a closer look at what happened to the US Dollar and why there could be more strength in store ahead.
For one thing, the US Dollar’s ascent has been met with a similar uptake in front-end Treasury Yields. That is a sign that financial markets are slowly pricing out near-term rate cuts from the Federal Reserve, which were aggressively priced ever since the collapse of Silicon Valley Bank (SVB) triggered liquidity and recessionary concerns.
In recent weeks, ebbing financial market volatility, sticky underlying US inflation and what appears to be a still-tight labor market underscored economic resilience amidst the most aggressive monetary tightening cycle in decades. Meanwhile, during a speech on Friday, Fed Chair Jerome Powell confirmed that interest rates might not have to rise as far given recent credit stress.
That said, he noted that he did not yet decide about future tightening and highlighted that the market rate path is much different from the central bank’s forecast. As such, markets are only pricing in about a 25% chance of another rate hike in June. As usual, incoming economic data will continue deciding the fate of monetary policy.
The US Dollar will be closely eyeing the PCE Core Deflator on Friday, due at 12:30 GMT. The Fed’s preferred inflation gauge is expected to remain unchanged at 4.6% y/y in April. That is not a good sign from the perspective of the central bank. Initial jobless claims will be another interesting print, due at the same time but on Thursday. There may yet be more room to cool near-term rate-cut bets, offering support for the US Dollar.
Technical Analysis
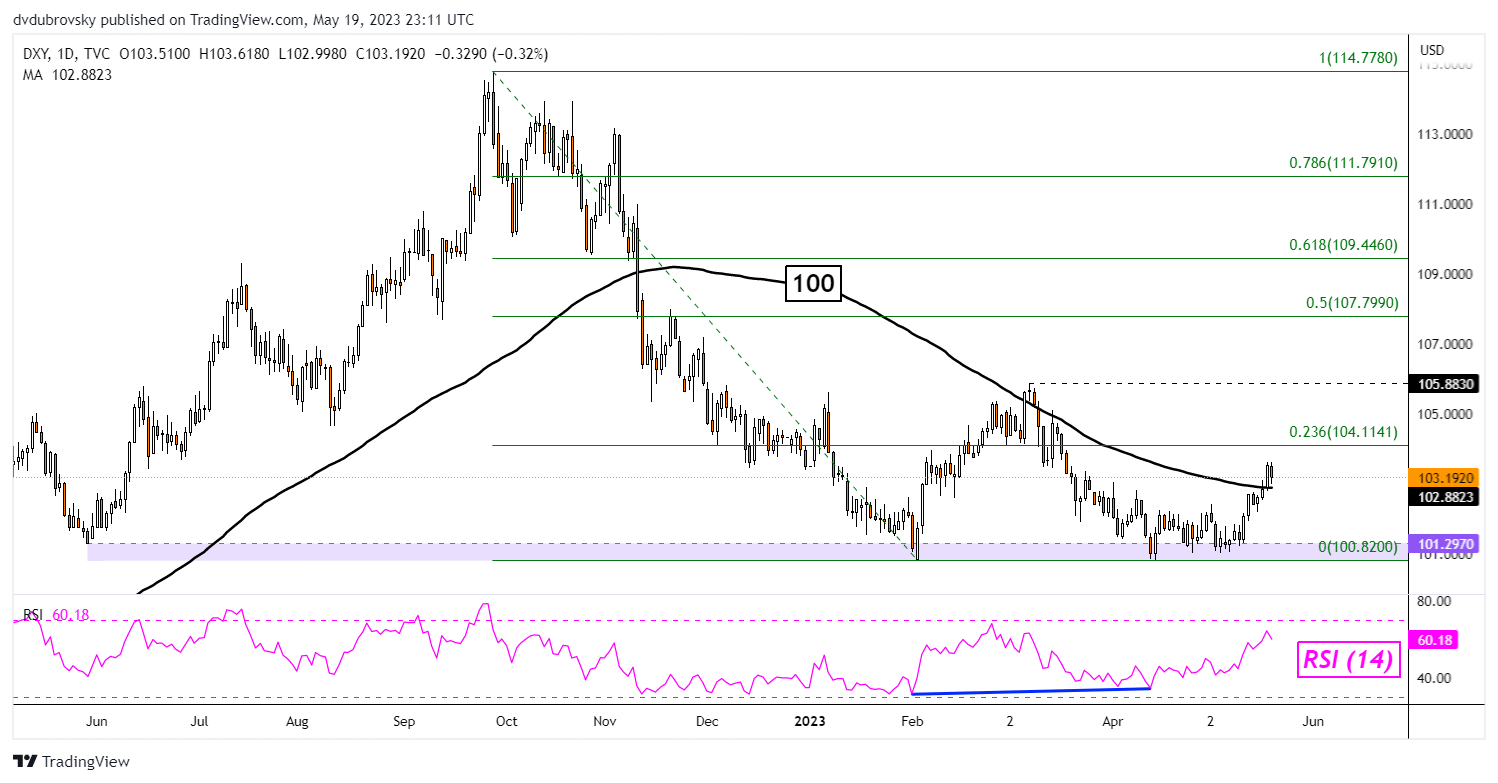
Looking at the daily chart, the US Dollar broke above the 100-day Simple Moving Average (SMA). This might be an early warning sign that the dominant downtrend since September might be turning. Key resistance appears to be the 23.6% Fibonacci retracement level at 104.11. Clearing that exposes the March high at 105.88. Otherwise, key support is the 100.82 – 101.29 zone.
- Pipscollector -